Hey there, fellow trader! Ready to boost your trading game with a sprinkle of Python magic? Let’s dive into a fascinating insight about the S&P 500: the average percentage difference between the opening price and the highest price recorded each day. This nifty trick can help you figure out the best time to close your positions, knowing there’s a high chance the price might reverse after hitting the daily high. By analyzing the S&P 500 opening to high price, we can uncover patterns that will give us an edge in trading. Grab a coffee, and let’s get into it!
Setting Up Your Python Environment
Before we get our hands dirty with data, let’s set up our Python environment. Make sure you’ve got Python installed, along with a few essential libraries. Don’t worry, it’s a breeze!
# Install necessary libraries
!pip install pandas numpy matplotlib yfinance
Fetching Historical Data for the S&P 500
We’ll use the yfinance library to fetch historical data for the S&P 500 ticker, SPY. This library is like having a personal data butler fetching market data directly from Yahoo Finance.
import yfinance as yf

# Define the ticker symbol
ticker = 'SPY'

# Get the historical market data
data = yf.download(ticker, start='2000-01-01', end='2023-01-01')

# Display the first few rows
print(data.head())
Calculating the S&P 500 Percentage Difference Opening to High
Time to crunch some numbers! We’re going to calculate the percentage difference between the opening price and the daily high. This metric will help us see the average peak point of the stock’s price during the trading day.
# Calculate the percentage difference
data['Pct_Diff'] = ((data['High'] - data['Open']) / data['Open']) * 100

# Display the first few rows with the new column
print(data[['Open', 'High', 'Pct_Diff']].head())
Analyzing the Data by Year
Now, let’s analyze the data to find the average percentage difference for each year. This will give us a clear picture of how the daily peaks have behaved over time.
# Extract year from the date index
data['Year'] = data.index.year

# Group by year and calculate the average percentage difference
annual_avg_pct_diff = data.groupby('Year')['Pct_Diff'].mean()

# Display the results in percentage format
annual_avg_pct_diff = annual_avg_pct_diff.map("{:.2f}%".format)
print(annual_avg_pct_diff)
Visualizing the S&P 500 Opening to High Price Difference
Let’s make those numbers dance! We’ll plot the average percentage difference for each year to spot any trends or patterns.
import matplotlib.pyplot as plt

# Plot the average percentage difference
plt.figure(figsize=(10, 6))
annual_avg_pct_diff.plot(kind='bar')
plt.title('Average Percentage Difference Between Opening and High Price (SPY)')
plt.xlabel('Year')
plt.ylabel('Average Percentage Difference')
plt.show()
Results: Interpreting the S&P 500 Opening to High Price Difference
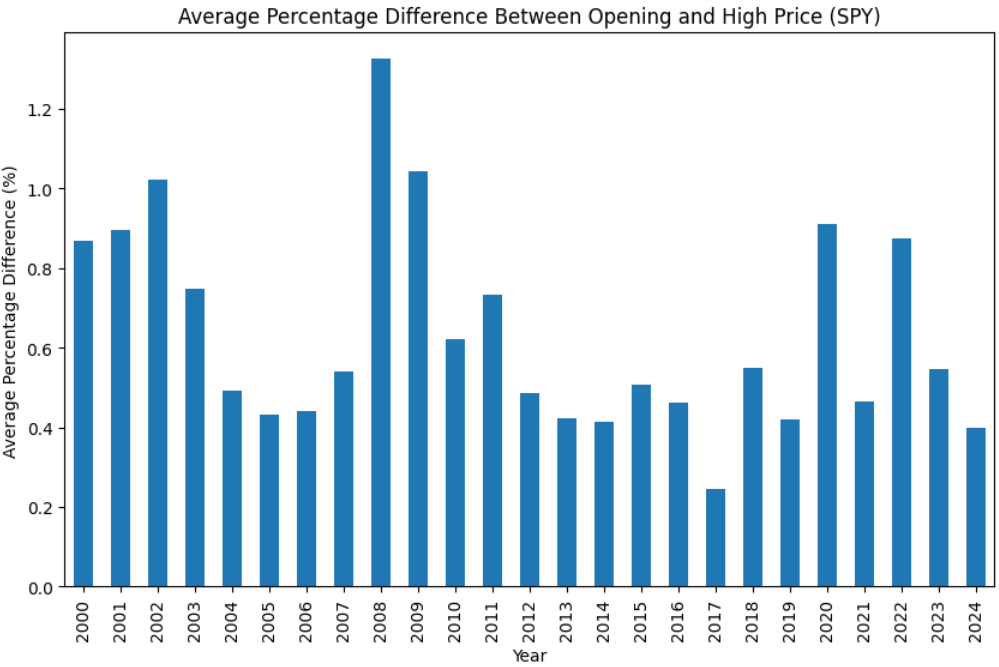
After running our script, we’ve unearthed some intriguing patterns in the S&P 500. Here’s what we found:
- 2000-2002: Early 2000s saw significant volatility, with average differences around 0.87% to 1.02%. This period includes the dot-com bubble burst, which caused considerable market fluctuations.
- 2008: The financial crisis year stands out with the highest average difference of 1.33%. High volatility was expected due to the economic turmoil.
- 2017: Marked by the lowest average difference of 0.25%, indicating a relatively stable market with fewer price swings.
- 2020: Another spike to 0.91%, reflecting the market’s response to the COVID-19 pandemic and its unprecedented impact.
These insights suggest that during periods of economic instability, the S&P 500 experiences greater daily price swings. Understanding these patterns can help you make more informed decisions on when to close your positions, especially during volatile times.
Conclusion
And there you have it! Understanding the S&P 500 opening to high price average percentage difference can give you a significant edge in trading. By knowing the typical peak point, you can make smarter decisions on when to close your positions, potentially maximizing your returns.
Keep experimenting, stay curious, and happy trading! For more tips and strategies, stick around QuantFinanceLab.com. Until next time, trade smart!